Dashboard
The Dashboard provides a high-level overview of your Unitrends environment from a single pane of glass. It displays protection status for assets, and summaries for all backup storage and active jobs. In addition, you can access community forums to ask questions or get information.
The Dashboard tiles summarize information for the appliance you are logged in to, as well any managed appliances. For example, if you are logged in to an appliance that is managing two others, Backup Summary counts include jobs and assets on all three appliances.
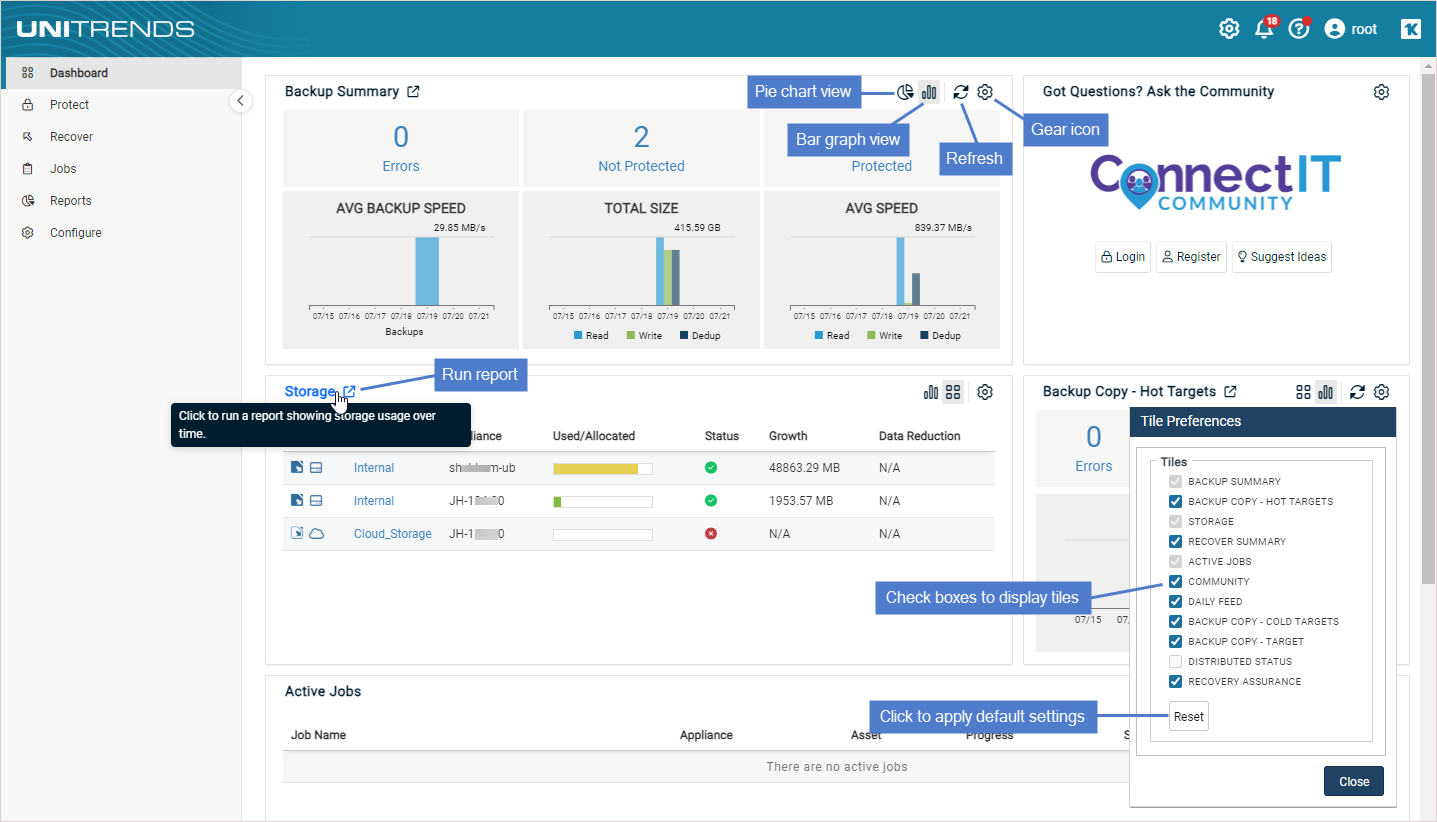
While working with the Dashboard, you can customize the display:
● To change the layout of the dashboard, click and hold the upper region of a tile, drag it to the desired location, and release.
●  – Click to run a report.
●  – Click to switch to pie chart view.
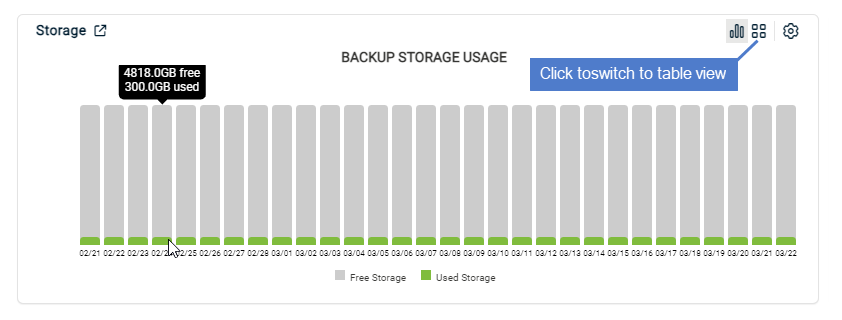
●  – Click to switch to bar graph view.
●  – Click to switch to table view.
●  – The Dashboard tiles update hourly. To update the tiles at any time, click in the top right corner of a tile. (Clicking refresh on the Backup Summary tile updates all other tiles.)
●  – Click to display the tile's preferences dialog. Preferences vary by tile. For example, in the Backup Summary tile's preferences dialog you can: check or clear boxes to display or hide tiles, or click Reset to apply the default layout for the current release. Click Close to exit the dialog. In the Active Jobs tile's preferences dialog you can also set the rate at which data is refreshed.
See these topics for descriptions of each tile:
 Backup Summary tile
This tile provides the following for backups that ran over the last seven days across all managed appliances:
NOTE Unitrends appliances, virtual hosts, and VM templates are not included in the number of protected and unprotected assets.
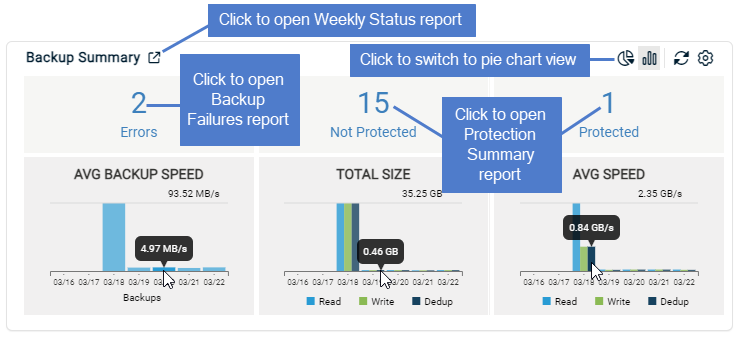
● Bar graph view –
● Errors – Displays all jobs, including canceled jobs, that ended in error within the last seven days. Click this number to open the Backup Failures report. Bar graph shows average backup speed for each day.
● Not protected – Displays the number of assets without a successful backup over the last seven days. Click this number to open the Protection Summary report. Bar graph shows the amount of data read, written, and deduplicated each day.
● Protected – Displays the number of assets with a valid backup over the last seven days. Click this number to open the Protection Summary report. Bar graph shows average read, write, and deduplication speed for each day.
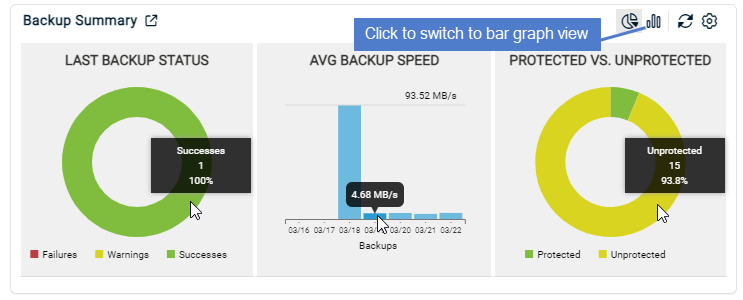
● Pie chart view –
● Last Backup Status – Displays a chart of last backup status for all protected assets.
● Avg Backup Speed – Average backup speed of all jobs that ran on a given day.
● Protected VS Unprotected – Displays the number of assets with a valid backup over the last seven days (protected) versus the number of assets without a valid backup over the last seven days (unprotected).
Got Questions? Ask the Community tile
From this tile, you can:
● Click Login to log in to the ConnectIT Community.
● Click Register to create a new ConnectIT Community account.
● Click Suggest ideas to provide feedback.

Storage tile
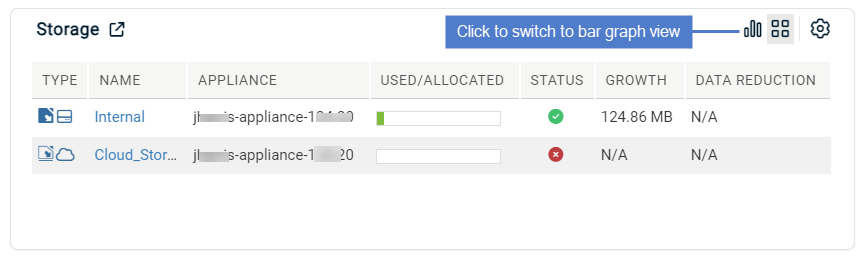
This tile shows these details about available and used storage for all managed appliances:
|
Field Name |
Description |
|---|---|
|
Type |
Hover over an icon to display the storage type. |
|
Name |
Name of the storage. |
|
Appliance |
Name of the appliance associated with this storage. |
|
Used/Allocated |
The amount of available and used storage. Hover to display the amount of space used versus the amount still available. |
|
Status |
Hover over the icon to display the current status of the storage. |
|
Growth |
Daily average percent change (increase/decrease) in the backup data store. |
|
Data Reduction |
Data reduction ratio (backup storage/bytes written). |
Table view example:
Bar graph view example:
Active Jobs tile
This tile displays an at-a-glance view of all jobs currently running on all managed appliances. This view includes the job name, the appliance name, the asset being protected, a progress bar, the percent of the job completed, the current status, and the length of time the job has been running.
To filter the list, click one of the following in the lower portion of the tile: All, Backup, Recover, Backup Copy, or Data Copy Access.
When a job displays in the tile, you can click the job name to view its progress at Jobs > Active Jobs. The job is highlighted and details display. After a job completes, it no longer displays in the Active Jobs tile.

Backup Copy – Hot Targets tile
Displays data about backups that were copied from this appliance to hot backup copy targets within the last seven days. Hot copy targets include the Unitrends Cloud Unitrends appliance targets that have been added to this appliance.
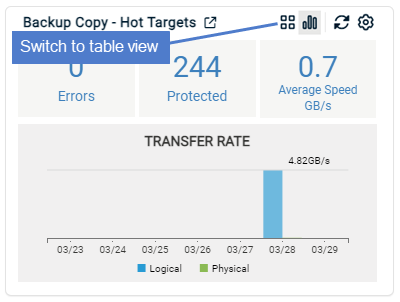
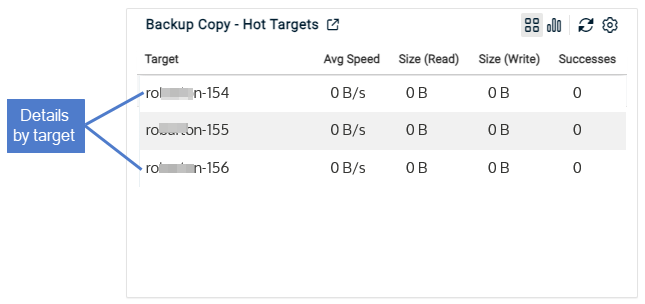
This tile displays the number of errors, protected assets, and unprotected assets for all hot copy targets. A bar graph indicates the day's average backup copy transfer rate. To view details by target, click  in the lower left corner. Click
  to return to the summary view.
● Errors – Displays the number of hot backup copy jobs that had errors within the last seven days. This includes canceled jobs that ended in error. Click this number to open the Backup Copy - Hot Targets report.
● Protected – Displays the number of assets that have successful backup copies that ran within the last seven days. Click this number to open the Protection Summary report.
● Average speed GB/s – Displays the average backup copy speed of all jobs that ran in last seven days. Click this number to open the Backup Copy - Hot Targets report.
● Transfer Rate - Displays the average data transfer rate of backup copy jobs, by day. Only new, unique blocks are transferred to the target. Physical shows the rate for data blocks that were transferred. Logical shows the rate for logical data transferred (not actual blocks sent). Hover over a bar in the graph to display the day's average rate in GB/s.
● Bar graph view includes data for all hot targets receiving copies from this appliance:
● Table view shows data by target:
Backup Copy – Cold Targets tile
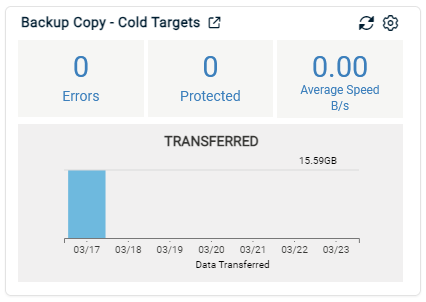
Displays data about backups that were copied to a cold backup copy target (eSATA, USB, tape, third-party cloud, attached disk, NAS, and SAN) within the last seven days. This tile displays the number of errors, protected assets, and average speed of backup copies to all cold backup copy targets. The performance graphs and average speed are calculated based on completed backup copies from appliances running version 9.0 or higher. This tile does not display data from jobs in progress or data from sources running Unitrends release 8.2 or earlier.
● Errors – Displays the number of backup copy jobs that failed over the last seven days.
● Protected – Displays the total number of protected assets and source appliances (each source appliance adds one to the count).
● Average speed B/s – Displays the average speed of completed backup copy jobs to this target from all sources.
Backup Copy – Target tile
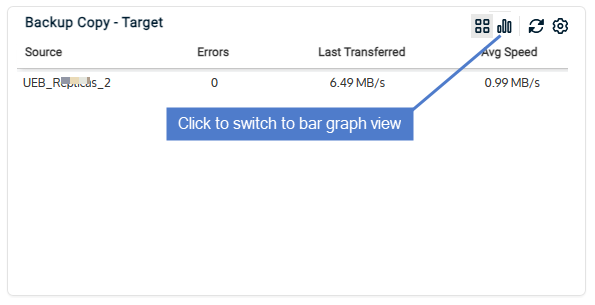
Displays data about backups that were copied to the appliance within the last seven days. Applicable only if the appliance is a hot backup copy target that is receiving backup copies from another Unitrends appliance. This tile displays the number of errors, protected assets, and average backup copy speed. Hover over a bar in the graph to display the amount of data transferred to the appliance on a given day.
● Errors – Displays the number of backup copy jobs that failed over the last seven days. Click this number to open the Backup Copy - Hot Targets report.
● Protected – Displays the total number of protected assets and source appliances (each source appliance adds one to the count). Click this number to open the Protection Summary report.
● Average speed MB/s – Displays the average speed of completed backup copy jobs to this target from all sources. Click this number to open the Backup Copy - Hot Targets report.
Bar graph view example:
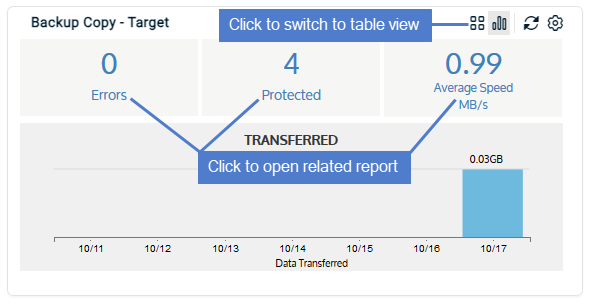
Table view example:
Recover Summary tile
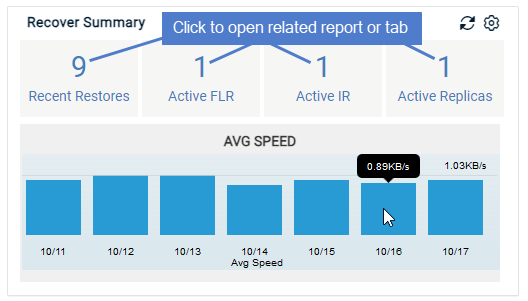
This tile displays details about recent recovery jobs on all managed appliances. Hover over a bar in the graph to display the average speed of the day's recovery jobs.
● Recent restores – Displays the number of recovery jobs in the last seven days. Click this number to open the Recovery History report.
● Active FLR – Displays the number of currently active file-level recovery objects. Click this number to open the File Level Recovery tab on the Recover page.
● Active IR – Displays the number of currently active instant recovery objects. Click this number to open the Instant Recovery tab on the Recover page.
● Active Replicas – Displays the number of currently active Windows and VM replicas. Click this number to open the Replicas tab on the Recover page.
● Avg speed – Displays the average speed of all recovery jobs that ran within the last seven days (current day not included). Hover over a bar in the graph to the display the average speed for a given day.
Daily Feed tile
The Daily Feed tile displays recent Tweets from Unitrends about our products and services.
Recovery Assurance tile
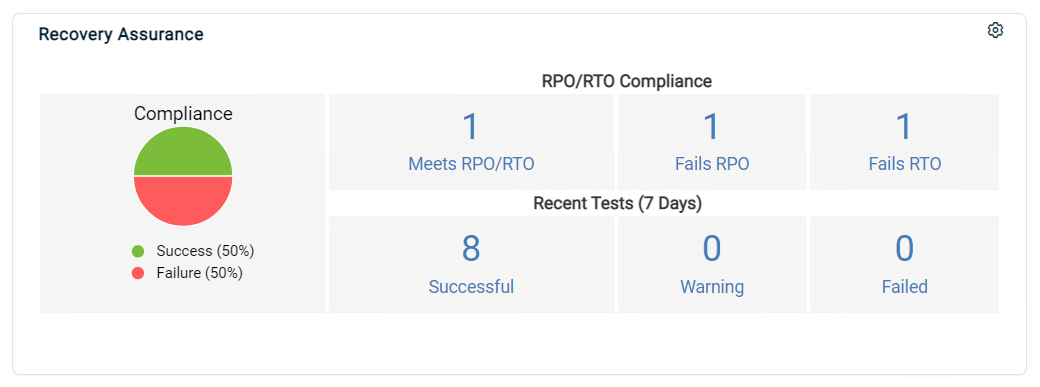
This tile displays information about Data Copy Access jobs.
● RPO/RTO compliance – Displays the total number of jobs that meet RPO/RTO, the total number of jobs that fail RPO, and the total number of jobs that fail RTO. Click any of these numbers to open the Compliance report.
● Recent Tests (7 Days) – Displays the total number of jobs that were successful, that completed with warnings, and that failed, over the past seven days. Click any of these numbers to open the Recovery Assurance report.