Using the Unitrends Dashboard
The Dashboard provides a high-level overview of your Unitrends environments.
By using the Dashboard, you can view the status of all Unitrends appliances at a glance, from a single pane of glass, and promptly address any issues.
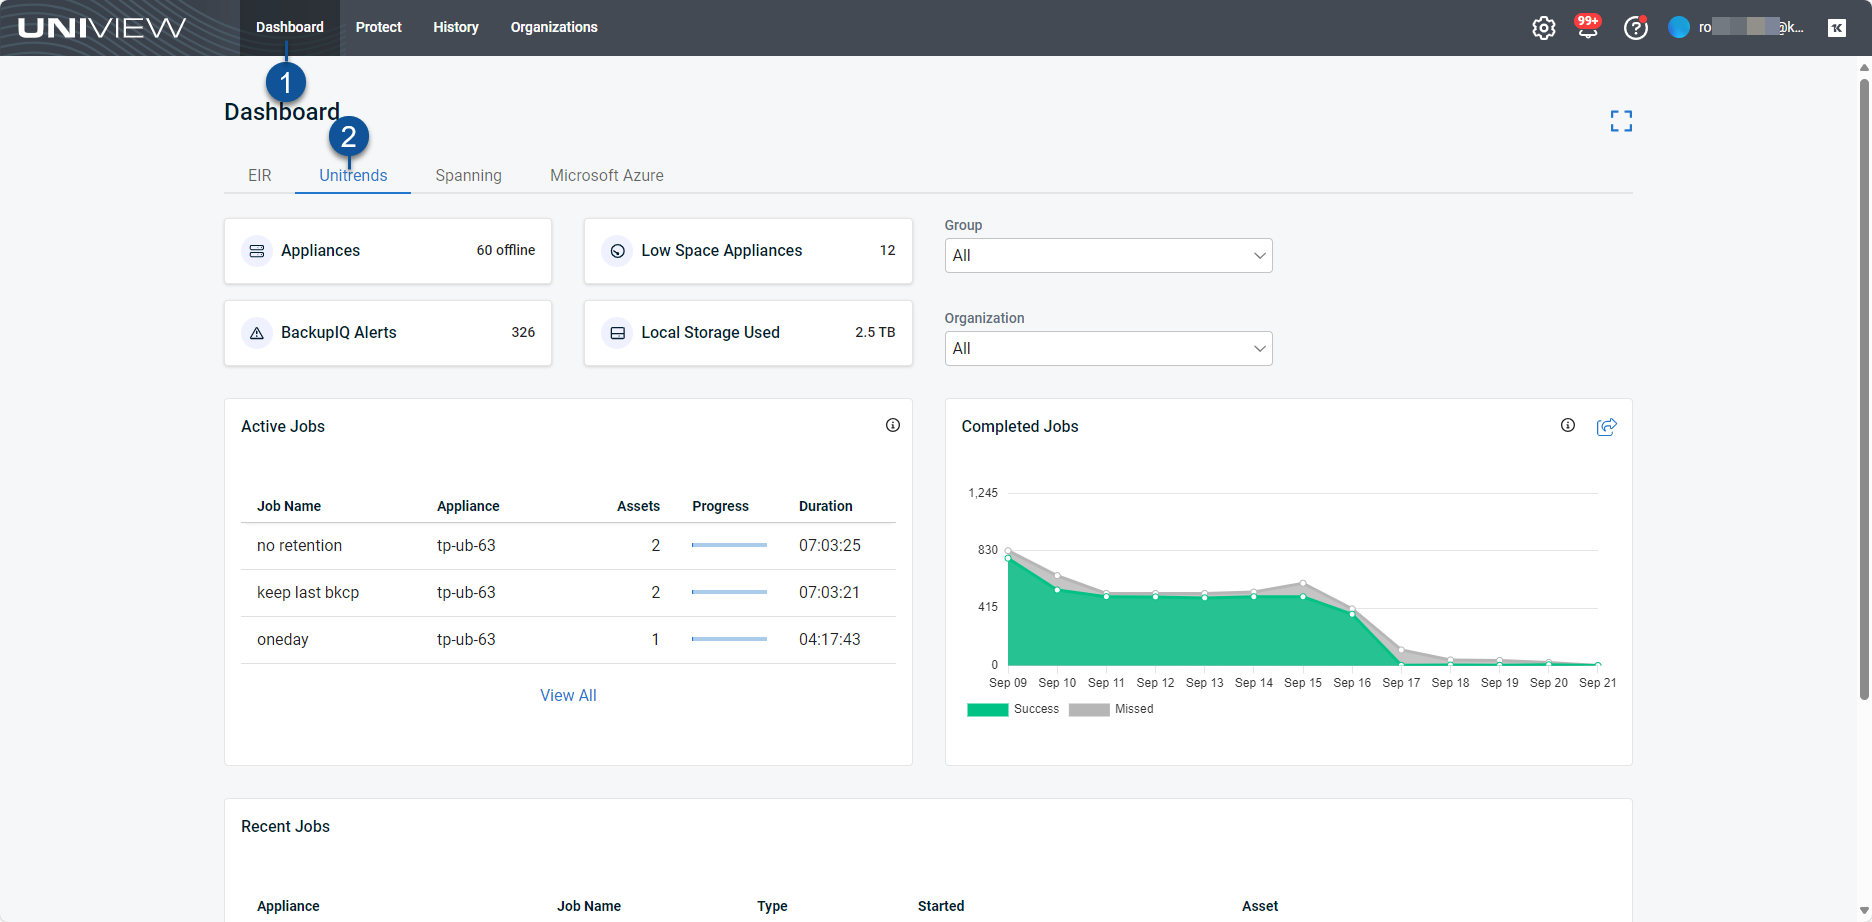
Dashboard tiles display the status of your appliances, alerts, low space appliances, storage usage, active jobs, completed jobs, and recent jobs.
See these topics for details:
Accessing the Dashboard
Click Dashboard to access the page:
Filtering the Dashboard
The Dashboard displays relevant information across all appliances that have been added to your backup.net instance. To filter the display, select an organization from the Organization list or a group from the Group list: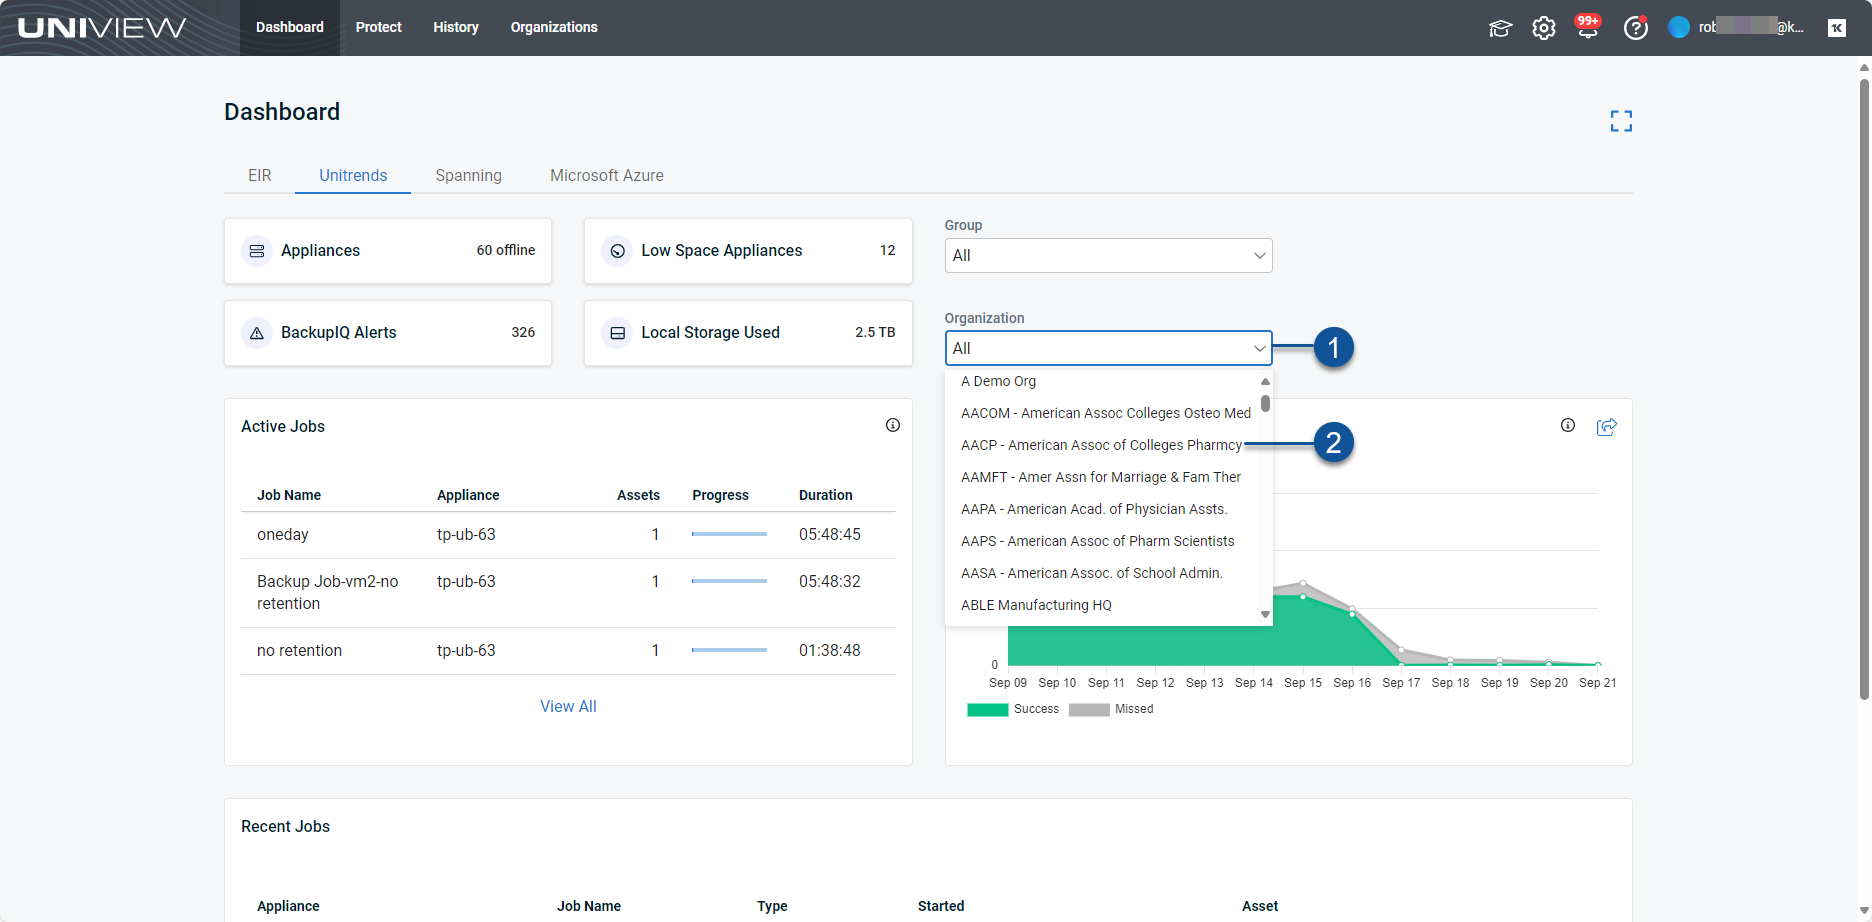
Appliances tile
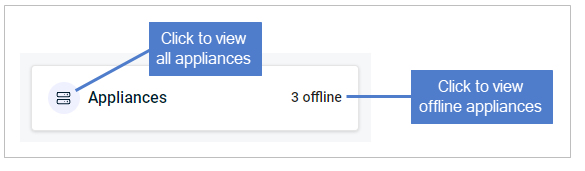
This tile shows the number of online and offline appliances.
- Appliances – Click to view all appliances on the Protect page.
- # offline – Click to view offline appliances on the Protect page.
Alerts tile
This tile shows the number of unresolved alerts across all Unitrends appliances (default view), by selected organization, or by selected group. Click the tile to view alerts in BackupIQ. See Alerts for details about alert conditions and setting up conditional alarm thresholds.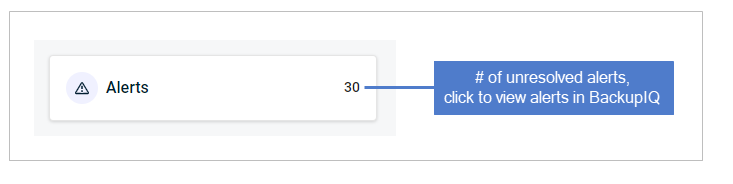
Low Space Appliances tile
This tile shows the number of appliances whose available space is less than 30%, across all Unitrends appliances (default view), by selected organization, or by selected group.
For details on managing appliance storage, see Backup Storage.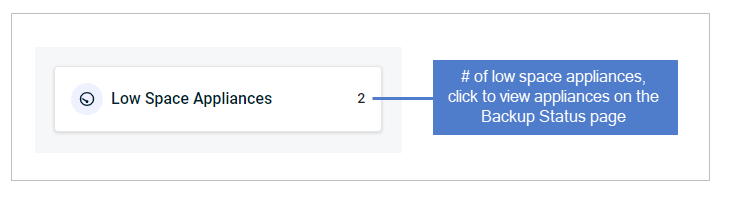
Local Storage Used tile
This tile shows the amount of local, on-appliance storage used across all Unitrends appliances (default view), by selected organization, or by selected group.
For details on managing appliance storage, see Backup Storage.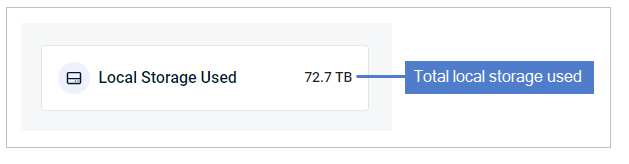
Active Jobs tile
This tile shows jobs currently running on all Unitrends appliances (default view), by selected organization, or by selected group. The tile displays up to three active jobs (those that started most recently).
These details are given for each job:
- Job Name – Name of the job.
- Appliance – Name of the Unitrends appliance running the job.
- Assets – Number of assets in the job.
- Progress – Bar indicating job progress.
- Duration – Time elapsed since the job started.
To view all active jobs, click See All. Active jobs display on the Jobs page (for details, see Using Jobs). 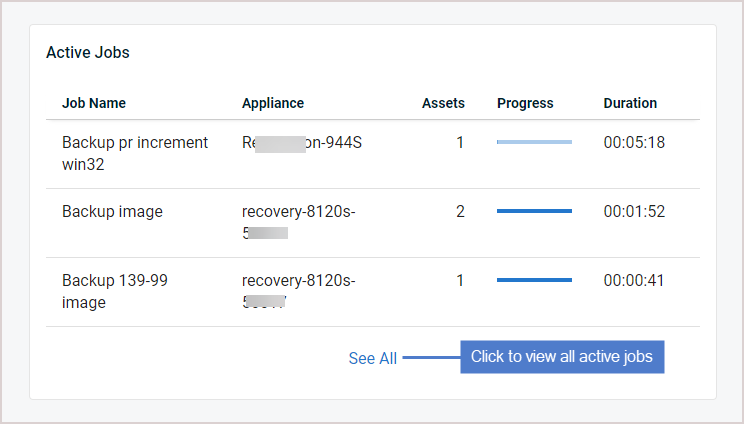
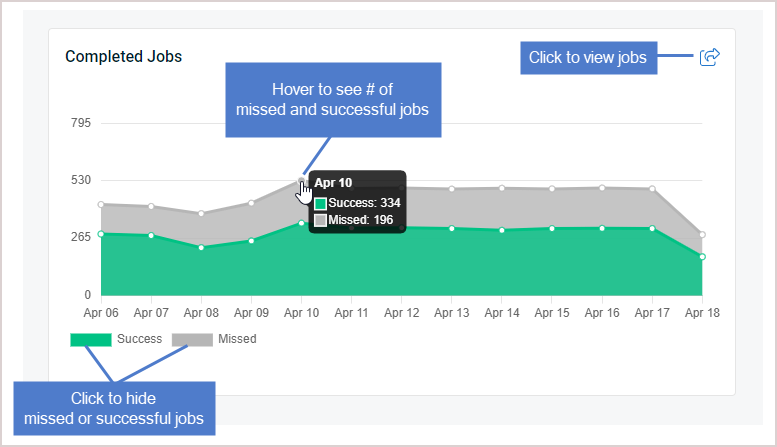
Completed Jobs tile
This tile shows the number of successful and missed jobs over the last 13 days across all Unitrends appliances (default view), by selected organization, or by selected group:
- Hover over a point in the graph to see the number of successful and missed jobs on a given day.
- Click Success to hide successful jobs.
- Click Missed to hide missed jobs.
- For details on completed jobs, see
Viewing job details.
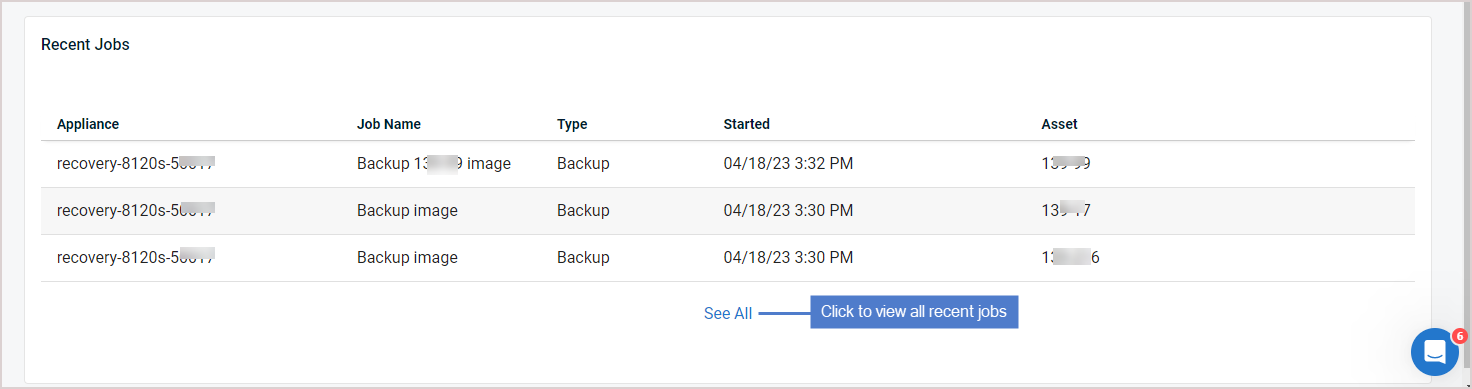
Recent Jobs tile
This tile shows the three most recent jobs across all Unitrends appliances (default view), by selected organization, or by selected group. These details are given for each job:
- Appliance – Name of the Unitrends appliance where the job ran.
- Job Name – Name of the job.
- Type – Job type.
- Started – Date and time when the job started.
- Asset – Asset name.
To view all jobs that ran over the last 13 days, click See All. Jobs display on the Jobs page (for details, see
Viewing recent jobs).